Those signals will only get you so far until you are ready to make a decision: that’s where ecommerce analytics comes in. For ecommerce, a hands-on analytics strategy will begin by aligning customer behavior with revenue results, and provide teams with a solid, evidence-based foundation on which to make decisions.
Creating a Measurement Framework that Supports Decisions
But it all begins with questions in order to have the best ecommerce analytics. There are a set of small ecommerce analytics metrics, an agreed set of definitions for each metric and an agreed reporting period required for each objective.
Establish business objectives prior to choosing indicators
Retention, contribution margin and inventory efficiencies may be key for a well established business. Thus, the appropriate ecommerce kpis vary with the business development and business priorities. What makes ecommerce analytics valuable is its ability to tie each and every metric to a particular action, which could be any of the following: make an ad budget decision, optimize delivery details on product pages, etc.
Maintain the accuracy of tracking from the start
If purchase events, transaction identifiers, refunds, discounts and even currency settings are not correct, it can negatively impact ecommerce data analytics. Each team should do a comparison on the analytics reports and orders and find out what might have caused any discrepancies. No matter how sophisticated an ecommerce analytics tool is, it can’t solve any duplicated conversions nor can it recover missing checkout events.
Five Core Measures That Explain Store Performance
An ecommerce analytics scorecard is one that delivers a balance of acquisition, conversion, customer value and profitability. Instead of looking through a number of individual charts, retailers can start by analyzing these five measurements and then explore how these changes make a difference to their business.
- When the denominator is consistently defined, conversion rate is the percentage of visits that lead to purchases.
- The Average order value is the average amount of money spent on an order placed by an individual customer.
- Customer acquisition cost is the ratio of spend on acquiring customers (that may be eligible) to the number of new customers.
- Customer lifetime value is the economic value that is created throughout a customer’s buying cycle.
- Contribution margin is defined as revenues left over after variable costs to make sales.
When assessing these ecommerce metrics, it’s important to take them all into account. Similarly, it will be less desirable to have low acquisition costs if your customers don’t return often. Ecommerce analytics should take into consideration the compromises instead of focusing on any single improving number to be a success.
Lose the Shopper’s Confidence Understanding
Behavioral measurement is used to tie product discovery to transactions. These patterns give a hint as to where to start looking, not why customers are defecating.
Segment Customers Instead of Trusting Averages
There are many differences in the behavior of customer groups. Ecommerce data analytics can enable you to compare cohorts on their acquisition channel, first purchase month, device category, etc. or anything else you choose. By looking at these ecommerce kpis in each of these groups, it will be easy to avoid capturing a good ecommerce performance in one area only to lose it in another. Another benefit of segmentation is that it enables ecommerce analytics to be more actionable by teams, as they can create targeted ecommerce improvements for specific audiences.
Use Experiments to Test Possible Improvements
If ecommerce analytics shows that there is a high rate of checkout abandonment, it is important to make a hypothesis and test a suitable change. Making notes of the hypothesis, measurement window, and the result makes it more reliable to make future decisions.
Marketing results mean revenue in the business world.In business, marketing results is revenue.
Marketing reports are on clicks, attributed revenue and finance reports are on costs and realized revenue. Both perspectives matter.
fairly compare acquisition sources
There are great ecommerce analytics tools to get the tagging, referrals and purchase data sorted. But, it is important to note that data for ecommerce metrics can vary amongst different platforms as each has different interactions.
Financial statements are limited sources of information because they don’t always include costs that the revenue represents.
When these factors such as product cost, shipping subsidies, payment fees, returns, and promotional discounts, are included in the ecommerce data analytics, it becomes commercially meaningful. Examples of ecommerce kpis that can be evaluated are contribution margin and acquisition payback, which can reveal campaigns that achieve great sales but poor economic returns.
Five Habits That Improve Reporting Quality
Any issues that come up as a result of the reporting process must be addressed and the issue must be held accountable, and this requires regular maintenance. A simple review process aids retailers in identifying and early detection of mistakes, target significant changes, and implement the changes into workable solutions.
- Designate responsibility for tracking definitions, implementation of events and reporting documentation.
- Regularly compare totals and amounts deducted from users’ accounts with their transactions.
- Check the cohorts of customers for new customers and repeat purchases.
- Look into any unusual activity prior to any budget, price or merchandising changes.
- Record experiments and decisions – teams can compare results over time.
These habits build analytics for ecommerce, but don’t necessarily involve a big tech stack. This can also assist ecommerce analytics tools in generating reports that teams are able to comprehend and have confidence in.
Choosing Technology and Developing a Review Routine
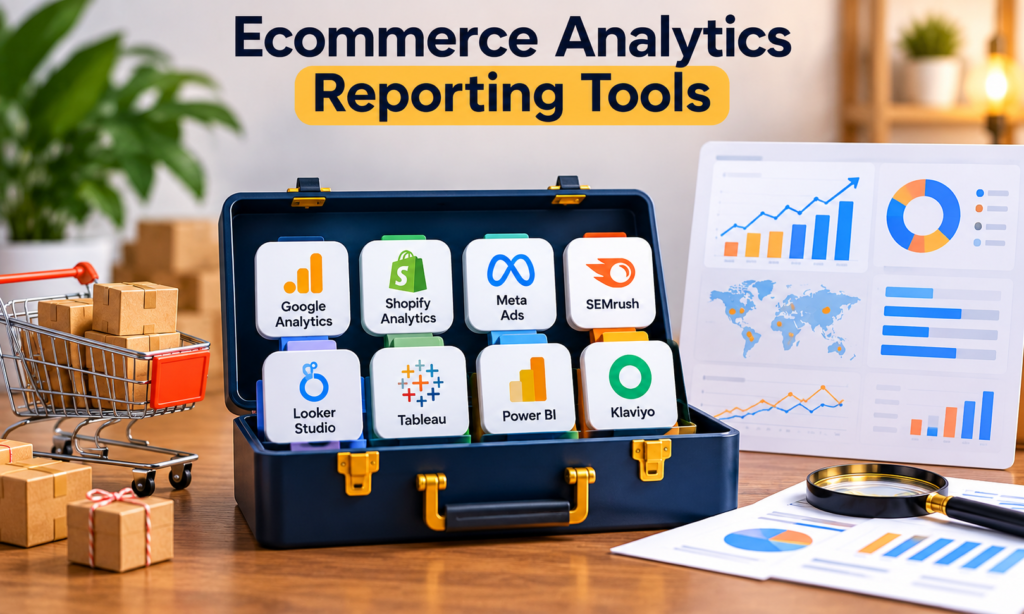
The first steps to picking ecommerce analytics tools are to start with business needs and existing integrations, the staff’s abilities, and privacy responsibilities. For smaller stores, there is a possibility of integration of platform reporting, web measurement and spreadsheets. Some more sophisticated operations might require a data warehouse, and special reporting. No matter the technology, the cornerstone of ecommerce data analytics is consistency, seamless data flows, and individuals with an ability to interpret the data.
Make Reporting Part of Regular Operations
Teams need to frequently discuss critical operational considerations as well as consider other metrics that are important to ecommerce, the timeframe of which should be long enough to show a significant trend. Ecommerce analytics is effective when it doesn’t just create more work but reports on the data to take action.
Conclusion
By integrating customer behaviour, marketing expenditure and profit, ecommerce analytics enables retailers to make well-informed decisions regarding their online marketing initiatives. Focus on metrics that are essential for ecommerce, test changes, and keep track of everything that happens that leads to better growth. Companies can make better decisions for their ecommerce activities without having to guess or use vanity metrics if they have disciplined analytics on ecommerce.
How to find the answers to common questions.
1. What does ecommerce analytics measure?
Ecommerce analytics gauges the paths customers take, their transactions, marketing efforts, customer retention, financial results, and more, helping to guide decisions.
2. What are the first signs that should be looked at?
Begin by starting with conversion rate, average order value, acquisition cost, repeat purchase and contribution margin. Choose other measures of ecommerce KPIs based on the business objectives.
3. Do high cost reporting platforms need to be used?
No – many basic store front reports and spreadsheets can answer many initial questions. Increased complexity of ecommerce reporting may necessitate the use of ecommerce analytics tools.
4. What is the frequency of review of the reports?
Review critical issues on an urgent basis on a daily, weekly and longer term basis, if they relate to the patterns of the campaign, and for longer term profitability for customers. To make any kind of meaningful conclusions about ecommerce data, it’s crucial to make comparisons.
5. How can retailers improve data quality?
Track auditing events, reconcile orders, documentation of definitions and investigations of discrepancy. A business’ credibility for ecommerce metrics relies on reliable data.